Have you ever experienced your application crashing with a system out of memory exception? Memory management is an important part of game development and can save you many headaches. In this post we will take a look at how memory is allocated, how you can profile the memory state of your application and finally – how can you improve it.
How memory works
The operating system is the manager of the memory. It allocates the amount of memory that processes can use. The applications will issue requests to it such as “I need more memory to run, please give it to me” or “I no longer need that bunch of memory, please take it and release it”.
Applications usually allocate their memory with some margin and then create a wrapper for such allocated chunks, making this memory available within their application using so-called allocators. When they need more memory than previously allocated margin, they issue a request to the OS to give them more memory. They sometimes can face rejection because the OS cannot give them more resources. This is how the ‘out of memory’ exception is thrown by an application which cannot longer function.
Memory fragmentation
Memory is sequential. It means that if you want to create e.g. array of data, the application allocates memory for that as a non-interrupted memory block. Memory blocks are allocated one after another. Frequent allocations and deallocations can lower the actual available memory for the application.
Let’s say that we have this memory block:

And these memory allocations:


We made some allocations during our application lifetime, so our memory block now looks like this:

Now we are releasing SuperLarge allocation from memory, so it looks like this:

Next we allocate a bunch of smaller allocations:

Now we want to allocate another SuperLarge allocation. There is a space available between the last Tiny and Large allocation, but there is too small room for uninterrupted SuperLarge allocation. Our application needs to issue a request to the OS to grant it more memory space. After that our memory block with allocated another SuperLarge allocation looks like this:

That gap in the memory block is called memory fragmentation.
Unity’s Garbage Collector has the ability to move blocks of memory in order to prevent memory from fragmentation, but it’s related only to Managed memory – we will cover it in the next chapter. It has no such power when it comes to Native memory – frequently allocation of that memory can cause memory fragmentation.
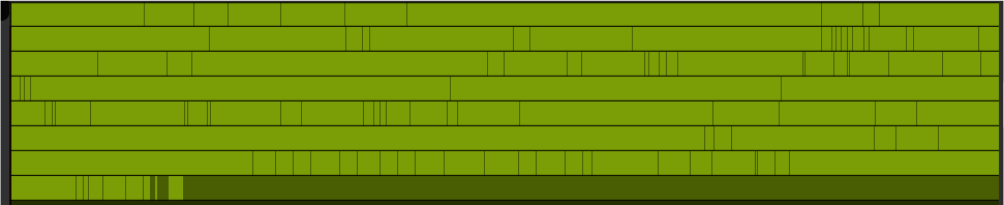
Below you can see examples of fragmented and non-fragmented memory. See how nice each memory allocation is lined up in the memory block when there is no (or little to no) fragmentation.

Types of memory
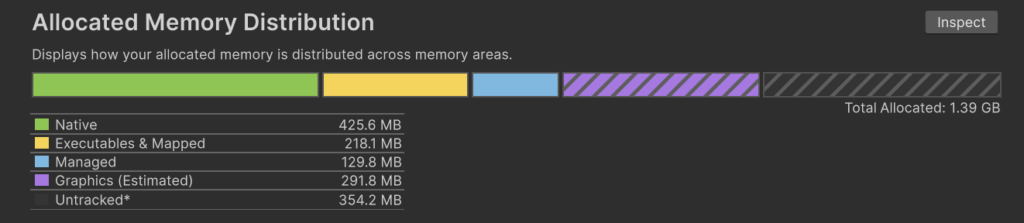
There are couple types of memory allocating by Unity:
- Native Memory
- Executables and Mapped
- Managed Memory
- GPU Driver Memory
- Untracked Memory
Native Memory is a part of memory allocated by Unity itself and build-in memory allocator. It is used by objects such as:
- Scene Objects (Game Objects and their Components),
- Assets and Managers
- Native Allocations including Native Arrays and other Native Containers
- CPU side of Graphics Asset memory
- And other
This is a memory which is not handled by the Garbage Collector.
Executables and Mapped is memory taken up by the build code of the application, including all shared libraries and assemblies, managed and native.
Managed Memory is a runtime C# memory. Here you will find all created lists, arrays, hashsets, class objects etc.
GPU Driver Memory – memory allocated by the GPU driver for the purpose of rendering. Here lies most of the textures, meshes etc.
Untracked Memory – memory allocated by third party plugins which Unity cannot track through its DLLs.
What is allocated in my project?
Now that we know how allocation in general works and what type of memory there is in Unity, let’s see how Unity is handling allocating particular objects.
The base principle is that Unity allocates what is inside a loaded scene and all references to any object which are held by loaded objects. What does it mean?
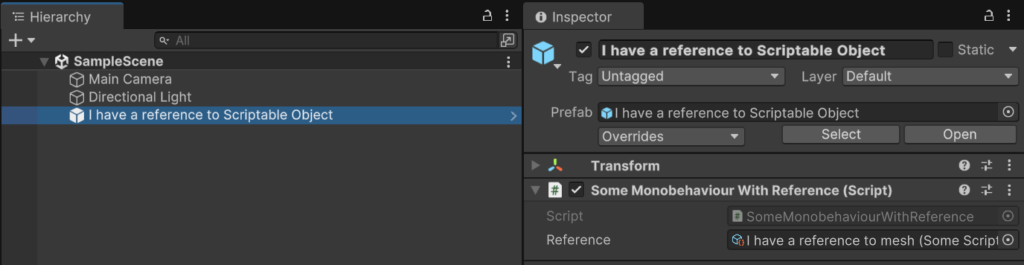
Let’s say that we are loading a scene with 5 objects. These objects are obviously loaded into memory. Now one of these objects has a MonoBehaviour script which contains a reference to a ScriptableObject. This ScriptableObject on the other hand has a reference to a mesh which is not used in the loaded scene. Result? The mesh references by the ScriptableObject will be loaded to the memory and kept in there until one part of the reference chain will be cut. This will probably happen after the scene was unloaded. It would be much worse if ScriptableObject would be referenced to a Singleton with DontDestroyOnLoad flag enabled. In that case the mesh would not be unloaded from the memory event after unloading the scene.
using UnityEngine;


public class SomeMonobehaviourWithReference : MonoBehaviour
{
   public Object reference;
}
using UnityEngine;
[CreateAssetMenu(fileName = "SomeScriptableObjectWithReference", menuName = "Scriptable Objects/SomeScriptableObjectWithReference")]
public class SomeScriptableObjectWithReference : ScriptableObject
{
public Object reference;
}

This example on a large scale can cause serious memory issues, in particular if there are references to objects which hold all game logic. How can we solve this? There are plenty of solutions, one of them is to use the Addressables system and load objects only when you need it.
Instead of having hard reference to a mesh, we could use AssetReference<TObject>:
[SerializeField] private AssetReference meshReference;Now we can use LoadAssetAsync<TObject>() to load our Asset Reference:
AsyncOperationHandle handle = meshReference.LoadAssetAsync<Mesh>();And ReleaseAsset() to release it from memory:
meshReference.ReleaseAsset();Besides references to assets, Unity always loads the contents of the Resource folder to the memory. Therefore using it is nowadays considered a bad practice.
My game has huge memory allocations. How to get rid of them?
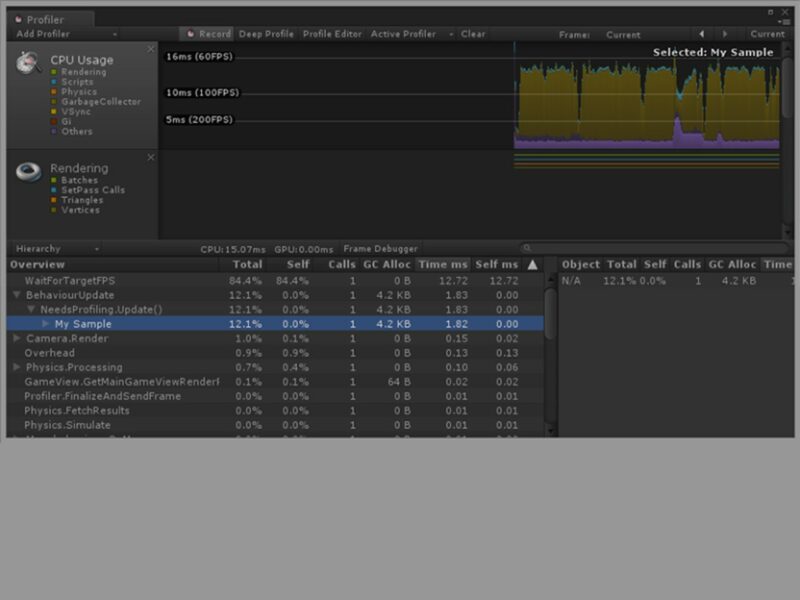
First you need to diagnose a source of the problem. You can do it by using Memory Profiler.
You can install Memory Profiler via Package Manager.
Before we jump in, you have to take memory snapshots of your project. There are couple of basic rules in terms of memory profiling:
- Always profile on the built project, on your target platform. Every platform has its own unique memory management, therefore profiling your project in the Editor will not give you relevant data. In fact, you will be profiling the Editor rather than your game. So make the build for your target platform, run it and then profile it.
- Make a couple of snapshots from a single gameplay. Every time you run a build, your applications memory can act differently. If you want to know what is a memory flow throughout your entire application you should make a couple of snapshots of a single gameplay in key points, e.g.:
- from the main menu after opening a game – this will give you knowledge about base memory loaded at the beginning,
- from the gameplay scene, right after loading it from the main menu – this will show you what you are loading at the beginning of the gameplay loop
- at the end of the gameplay session – this will show you which parts are constant in the memory and which are unloading
- in the main menu, after the gameplay session – this will tell you if gameplay assets are properly unloaded after quitting to the main menu.
Additionally you can add a couple of snapshots throughout the gameplay to inspect your memory behaviour in particular places of your game that you are interested in examining.
- If possible, make memory snapshots on the device with extended RAM. If you struggle with quickly reaching maximum memory capacity of a device, you would like to profile it on a device with extended RAM in order to be able to make proper snapshots and diagnose the problem.
- If possible, use different tools to profile memory alongside Memory Profiler. Memory Profiler can only estimate the memory usage and sometimes does not show everything. That is why you should compare its output with other tools.
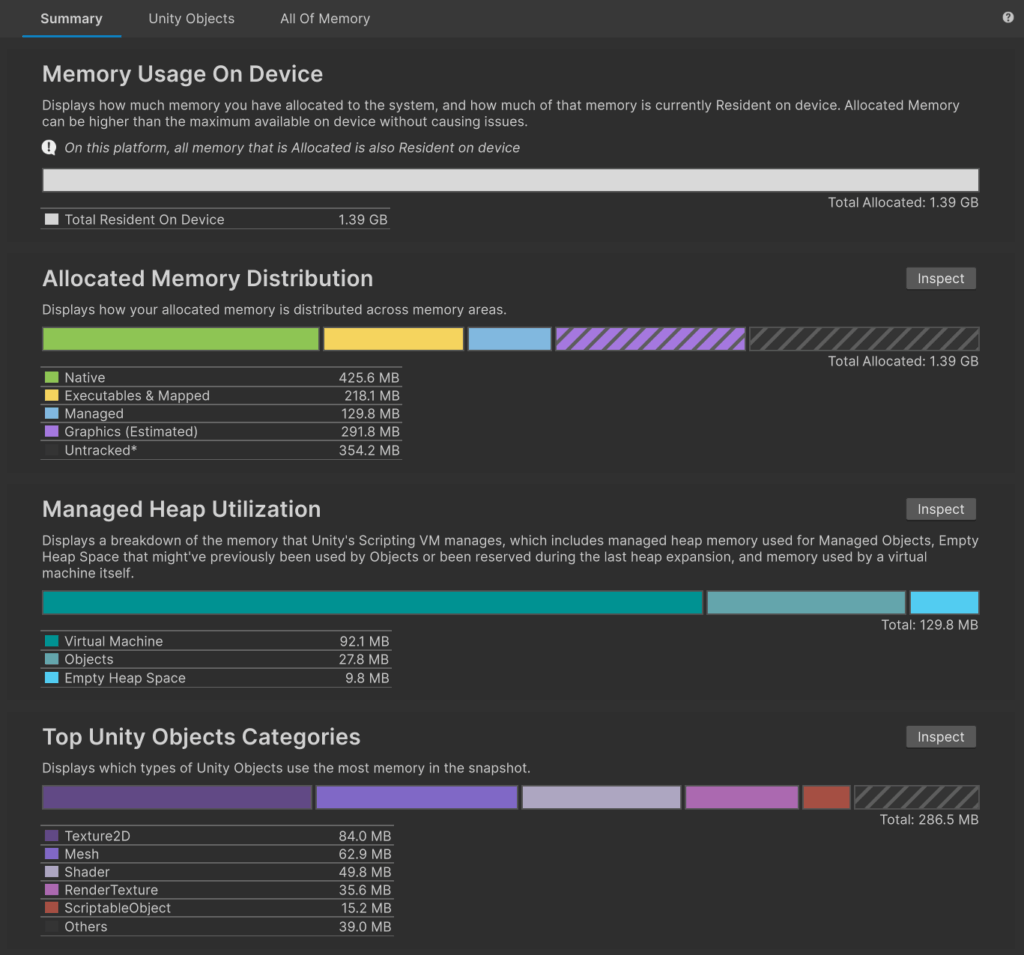
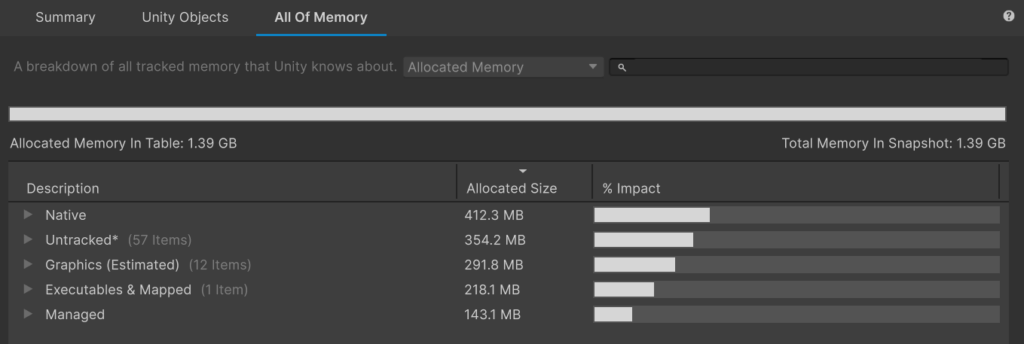
The newest version of Memory Profiler contains 3 tabs:
- Summary – overall visualization of used memory
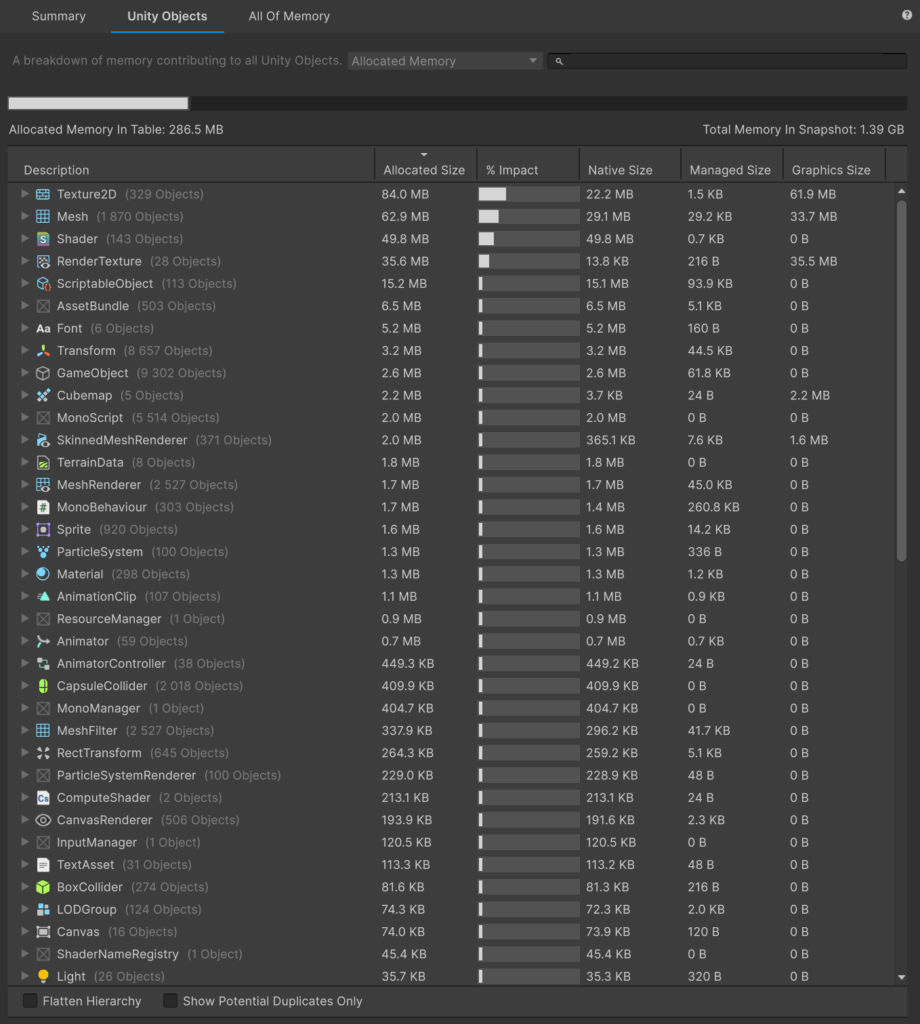
- Unity Objects – list of all Unity objects with their allocated size, percentage impact to all memory, native size, managed size and graphic size.
- All Of Memory – list of all objects allocated in memory with division to memory type.
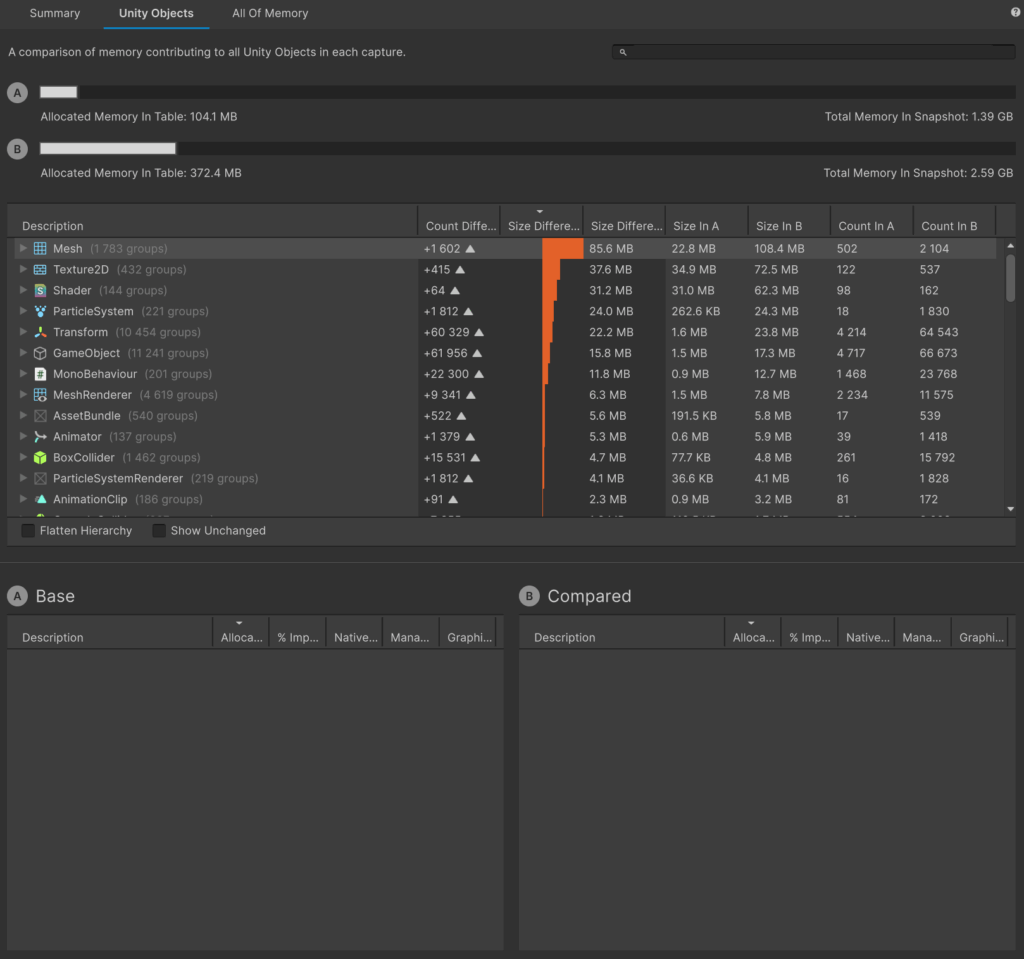
You can view snapshots in single mode as well as in compare mode. This is useful if you want to show differences between particular parts of your game.
After inspecting memory snapshots you can evaluate what is the root problem in your case. Is it too much of a base memory and assets are just taking up too much space in memory? Or maybe there are some memory leaks throughout gameplay which are causing crashes? Let’s see how we can resolve each case.
What’s taking up so much?
During memory optimization, the first thing you should do is to check which assets are taking up the most memory and how you can improve it. You just want to reach for the low hanging fruits at first as it is the easiest way to improve memory management in your project by lowering the base memory amount. So what could it be?
Texture2D
The size of texture in RAM depends solely on the:
- Texture’s resolution
- Texture’s format
- Number of mip-maps
Texture’s size in RAM does not depend on Crunch compression! Crunch compression has only an impact on the texture’s size in build. After loading such a texture to RAM it is ‘unpacked’. So the size of a RGB Compressed DXT1 texture and RGB Crunched DXT1 texture is the same in RAM, even if Editor is claiming differently. It is good to keep that in mind.
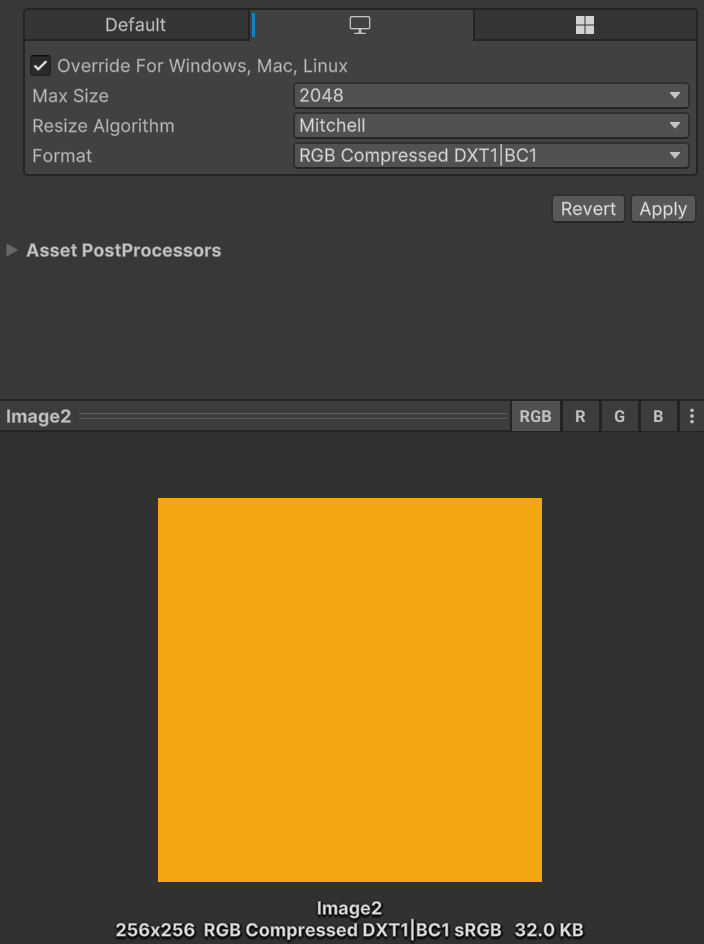
It is a good practice to keep the texture’s resolution no bigger than the resolution of your target device. The 4K texture will not show all of its details on a 720p screen. You adjust the max size of a texture in the texture importer in the Editor.
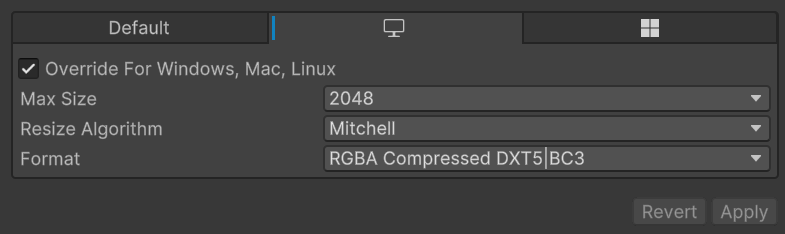
You can also set a format which texture will be compressed to. The most important thing to remember about that is the resolution of compressed textures has to be a multiple of the size of a compression block. It means that e.g. DXT1 compression which has a 4×4 compression block requires the resolution of the compressed texture to be a multiple of 4.
An exception to that rule is ASTC compression which can compress everything, except a texture with a mipmaps which is not a power-of-two.
If a texture has mip-maps, in order to be compressible, it has to have a power-of-two resolution. So a 800×1200 texture with mip-maps cannot be compressed, however it is possible with a 1024×1024 texture.
You can see it in the following example. A 256×255 texture is marked as NPOT and cannot be compressed.
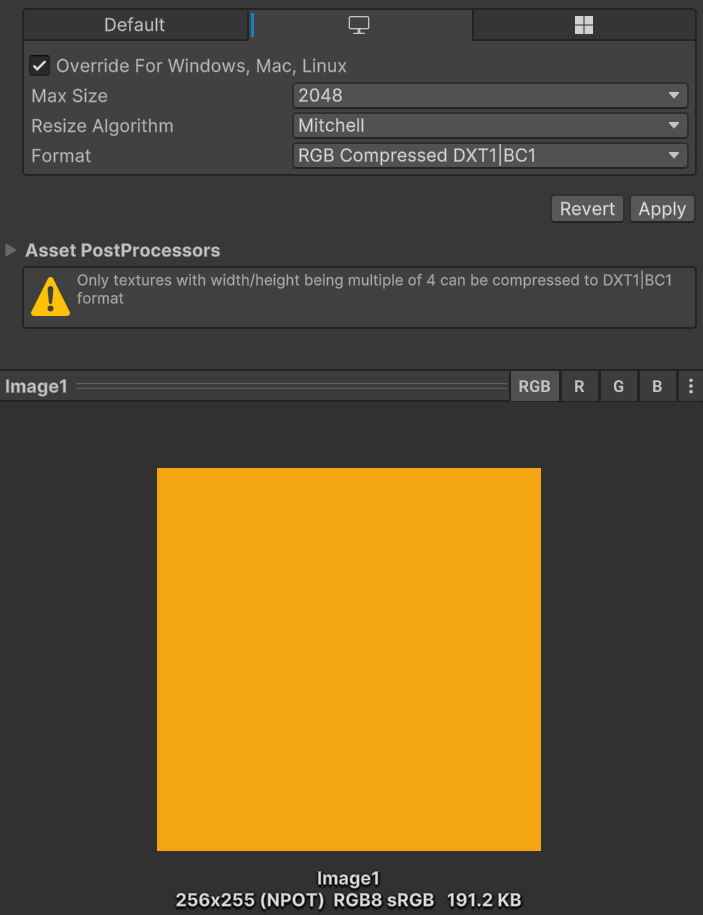
After adding just one row of pixels it becomes POT and compressible, which reduces its size almost six times.
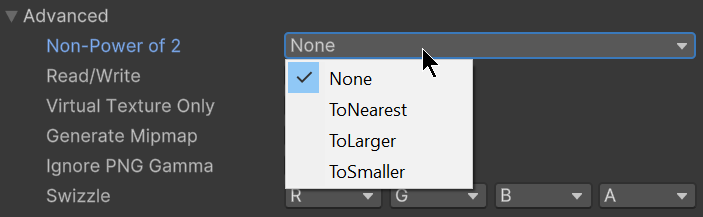
You can also tell the texture importer to automatically scale NPOT texture. The options are: 1) ToNearest 2) ToLarger 3) ToSmaller. It is a convenient way to make sure that imported texture can be compressed, although sometimes you will want to do it manually for better control.
Below you have a cheat sheet showing which textures can be compressed in relation to mip-maps.
| Not supported resolution (e.g. 193×921) | Multiple by 4 resolution (e.g. 356×272) | Power-of-two resolution (e.g. 256×256) | |
| Mip mapy enabled | no compression | no compression | compression available |
| Mip mapy disabled | no compression* | compression available | compression available |
Mesh
Meshes can consume a large amount of project memory, in particular if they are complex and huge in number.
There are a couple things you can do to reduce the size of meshes:
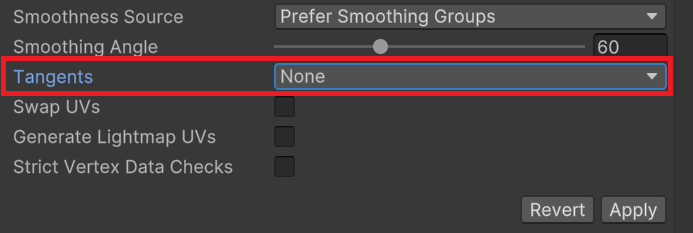
- If your mesh is not using normal maps or any other effects based on tangent space, you can go ahead and turn off importing tangents.
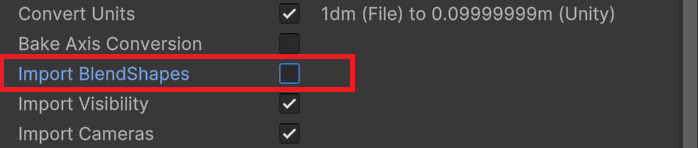
- If your mesh has animations that are not used, you can turn off Import Blend Shapes.
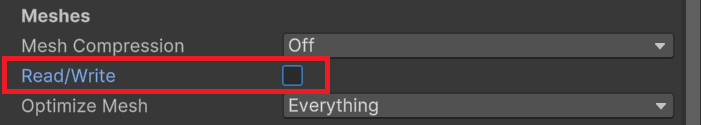
- Remember to keep the Read/Write enabled flag to false if you do not need it (e.g. if you do not want to modify it in runtime). If you enable this option, mesh will be duplicated and kept in RAM as well as in GPU memory.
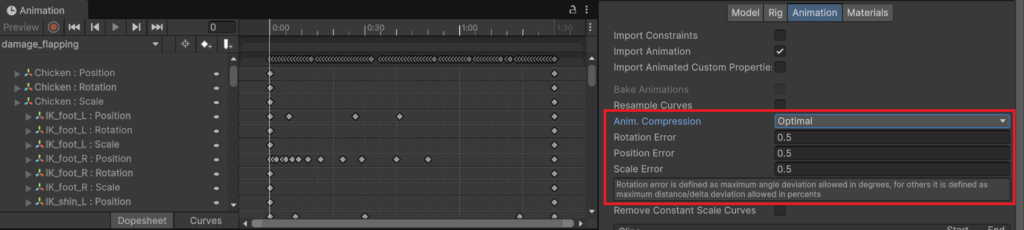
Animation
You can decrease the animation size of imported models by enabling Animation Compression. This way Unity will omit some of the unnecessary keyframes.
Shader
Every shader can have multiple variants, meaning it can be compiled multiple times and used for different features. In practice there can be a situation when some of the shader variants wont be necessary – it depends on the number of lights, their settings or quality settings. That is why it is important to track shader variants and control them. Unity often cannot tell which variants to strip, aka exclude from the build, so you have to do this on your own.
You can do it by adding IPreprocessShaders script to your project, like so:
using System.Collections.Generic;
using System.Linq;
using UnityEngine;
using UnityEngine.Rendering;
using UnityEditor.Build;
using UnityEditor.Rendering;


public class ShaderStripper : IPreprocessShaders
{
   private List<ShaderKeyword> keywords = new List<ShaderKeyword>()
   {
       new ShaderKeyword("POINT_COOKIE"),
       new ShaderKeyword("DIRECTIONAL_COOKIE"),
   };


   public int callbackOrder { get { return 0; } }


   public void OnProcessShader(Shader shader, ShaderSnippetData snippet, IList<ShaderCompilerData> data)
   {
       StripVariants(shader, snippet, data, keywords);
   }


   private void StripVariants(Shader shader, ShaderSnippetData snippet, IList<ShaderCompilerData> data, List<ShaderKeyword> keywordsToStrip)
   {
       for (int i = 0; i < data.Count; ++i)
       {
           if (keywordsToStrip.Any(keyword => data[i].shaderKeywordSet.IsEnabled(keyword)))
           {
               data.RemoveAt(i);
               --i;
           }
       }
   }
}
It is enough to have it laying somewhere in your project – it will be executed during compilation.
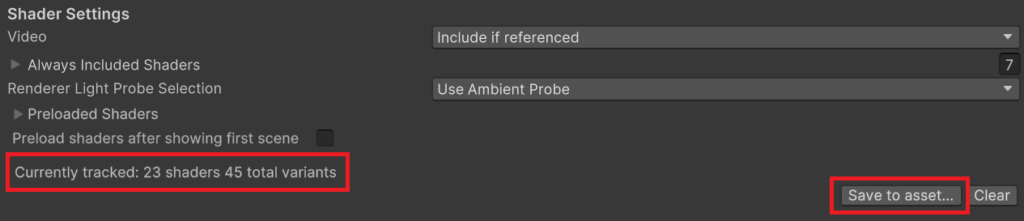
You can track the number of shaders and shader variants used in your project via Project Settings -> Graphics window. Go into Play Mode and play your game. Notice how those numbers are increasing each time another shader variant needs to be loaded. If you are satisfied with the current state, exit Play Mode and click on the ‘Save to asset…’ button to save the list of shader variants to the .shadervariants file. Next you can view this file in Inspector and check which shader variants were being loaded.
Based on that you should establish which shader variant can be stripped. Just add appropriate keywords to your script and you should notice much lighter shaders in the build.
There is also another ‘magic’ setting in Unity which can improve memory usage of shader variants called Shader Variant Loading Settings. You can find it in Project Settings -> Player Settings -> Other Settings.

Unity stores several ‘chunks’ of compressed shader variant data. Each chunk contains multiple shader variants. When Unity loads a scene at runtime, it loads all the scene’s chunks into CPU memory and decompresses them. By default, Unity decompresses all the shader variants into another area of CPU memory. Then Unity passes the shader variant and its data to the graphics API and the graphics driver. The graphics driver creates a GPU-specific version of the shader variant and uploads it to the GPU. Unity caches each GPU-specific shader variant, to avoid another stall when Unity needs the shader variant again. Finally, Unity removes the shader variant completely from CPU and GPU memory when there are no longer any objects that reference the shader variant.
With Shader Variant Loading Settings you can control the size of chunks and how many decompressed chunks Unity keeps in memory.
- Default chunk size (MB) controls the maximum size of compressed chunks.
- Default chunk count controls how many decompressed chunks Unity keeps in memory. The default is 0, which means there’s no limit.
You can override those values for every platform. If you decide to override it, you should experiment with different values to see how it impacts your project’s runtime. This setting is useful in particular on platforms with limited memory.
What about memory leaks?
If memory usage of your application is consistently and substantially rising during the gameplay loop, you are probably dealing with memory leak.
Memory leak is a state where there are objects in the memory which will no longer be used. This situation can arise because of couple of reasons:
- There is a reference to an object which will no longer be used and GC cannot release it from memory because of said reference.
- There are structures used which require manual allocation and deallocation and the latter is not executing.
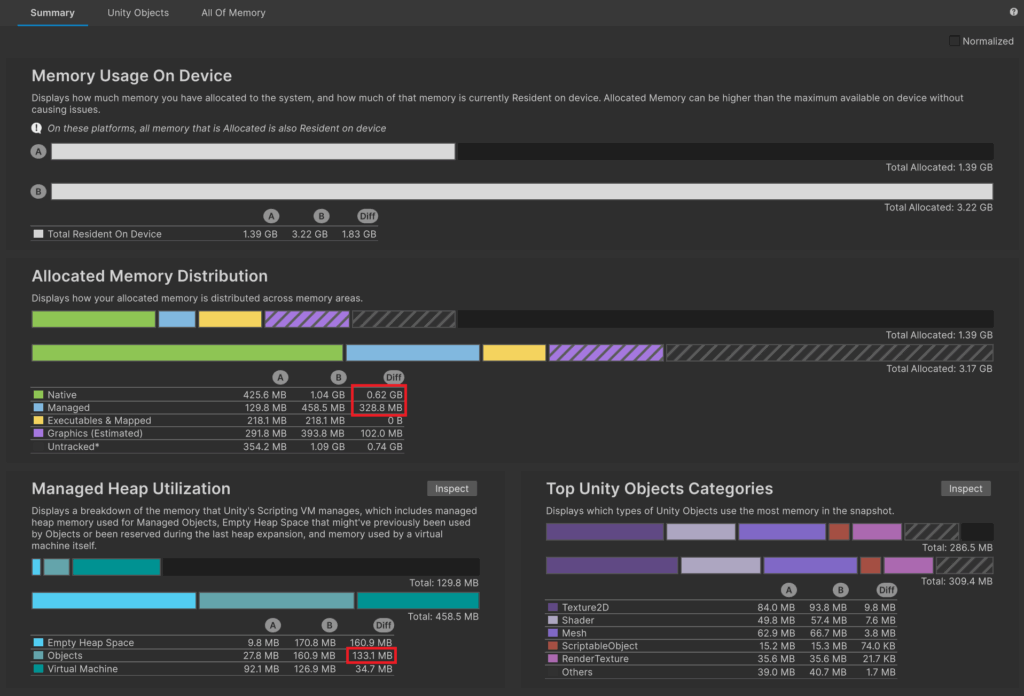
To detect a memory leak you should profile the memory of your application during the main game loop. Remember about profiling principles which we covered earlier. Analyze and compare memory snapshots after a couple of main game loop iterations. If memory is rising roughly 10-20MB then it is likely no problem – could be just fragmentation. If it is much more, e.g. 100MB then it is probably a memory leak.
Here we can see a huge memory leak. These two snapshots were taken in the main menu of the game – first one at the beginning of the gameplay, second after a couple of main game loop iterations.
You can also enable memory leaks detection in the Editor but it refers only to native allocation, such as NativeArray, UnsafeList, UnsafeParallelHashSet, AllocatorManager.Allocate() etc.
You can turn it on in the Preferences -> Jobs tab. Native memory leaks will be printed in the console as errors.
How to fix a memory leak?
To find a particular memory leak, you should open a memory snapshot in single mode and move to All Of Memory tab. You can actually type ‘leaked’ in the search bar and the list below will show all managed shell leaks (they are marked as ‘Leaked Managed Shell’).
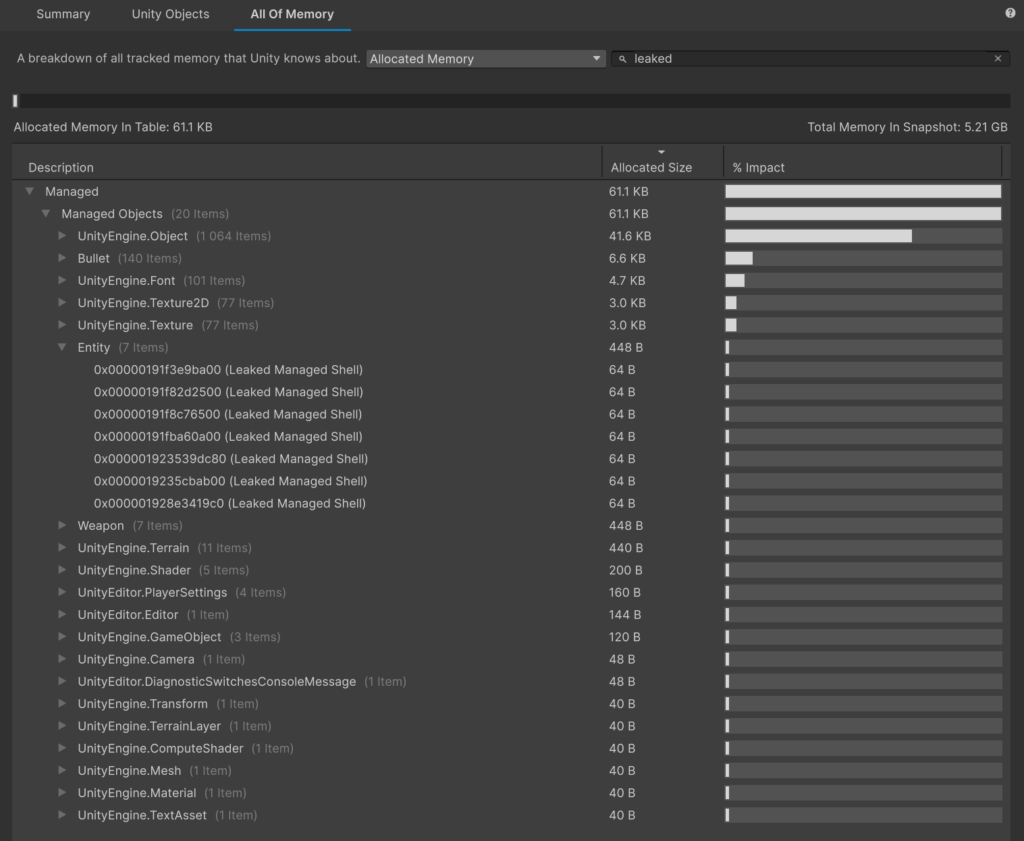
Let’s take a look at a simple example of a memory leak that was prepared for the need of this post. Looking at the memory snapshot we can see that there are 140 objects called ‘Bullet’ leaked.
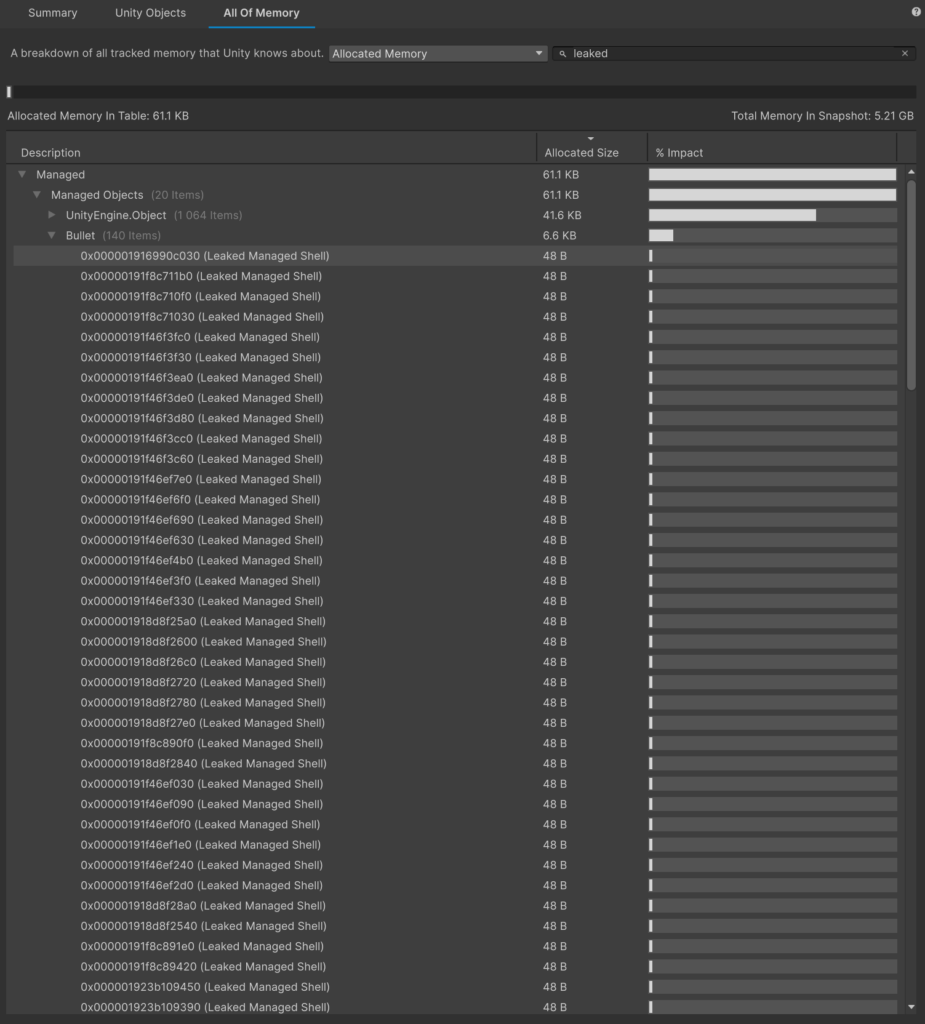
Let’s select one of them and focus on the right side of the memory profiler window.
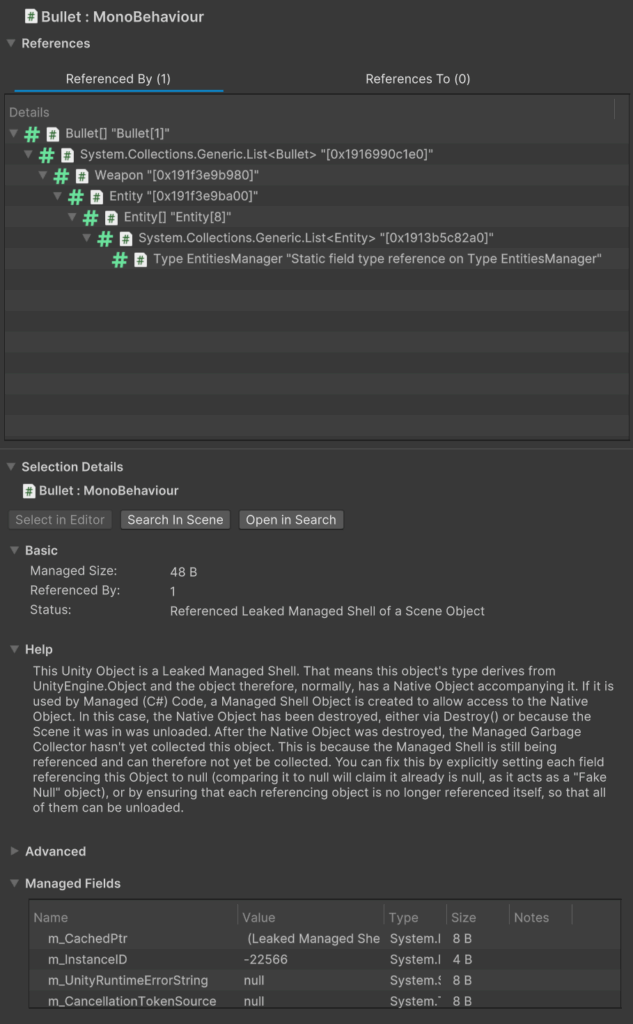
We can see References and Selection Details sections. As you can see under the Selection Details, Unity is even instructing us why this object is a leak. It appears that it was supposed to be destroyed but Garbage Collector was not able to release it because the object is still being referenced somewhere. Let’s focus on the Referenced By tab above.
How to read that tree?
- Reference to List<Bullet> is stored in object of type Weapon
- Reference to object of type Weapon is stored in object of type Entity
- Reference to Entity is stored in a List<Entity>
- List<Entity> is stored in a type of EntitiesManager as a ‘Static field type reference on Type EntitiesManager’
We have reached the root of our problem – it is the static reference to List<Entity> in EntitiesManager. What is happening here is Entities objects were destroyed after unloading a scene where they were instantiated but they are still referenced and therefore were not released from memory. What is more, Entity kept a reference to another object – Weapon and Weapon kept a reference to Bullet objects, so they were also not released from memory.
public class EntitiesManager : MonoBehaviour
{
   public static List<Entity> Entities { get; private set; } = new List<Entity>();

   ...
}
After properly releasing static references, everything should be fine.
Summary
As you can see, there are different possible sources of memory issues, as well as many tools and practices to fight them. As with every kind of optimization, the most important is to correctly recognize the root of an issue. I hope the knowledge presented in this post helps you in properly managing memory in your project.