The Unity Profiler Samples is something that most of Unity users are unaware of. Yet it can be extremely helpful if you want to find out what amount of resources your code takes during the execution.
If you’re already familiar with built-in profiler then you might know that by default it is not profiling all method calls. Also, the Deep Profiling causes large overhead that will significantly slow down your application execution and it even may not be possible to perform the profiling activity at all (Unity can run out of memory). The Profiler Samples are quite useful here.
Profiler Sample is a block of code that starts with Profiler.BeginSample() and ends with Profiler.EndSample() calls. Just like this:
using UnityEngine;

public class NeedsProfiling : MonoBehaviour {

    void Update() {
        Profiler.BeginSample("My Sample");
        Debug.Log("This code is beign profiled");
        Profiler.EndSample();
    }

}
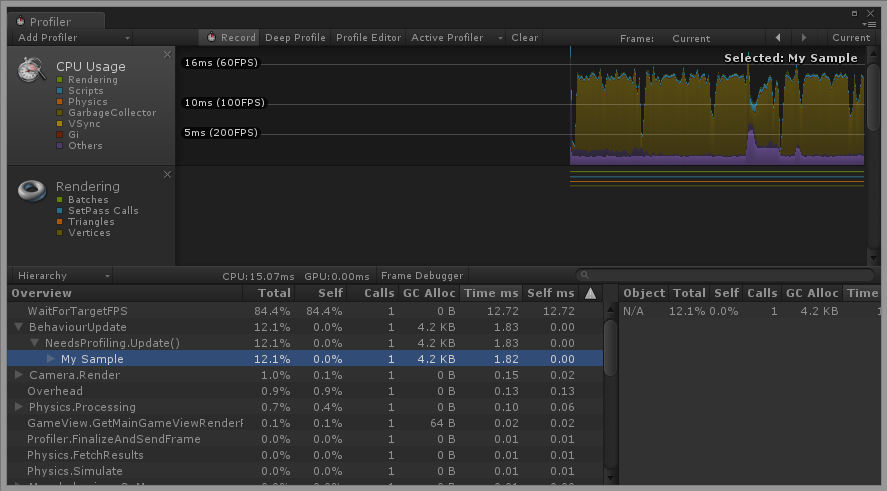
Normally, you would put it before and after the chunk of code that you want to be profiled. Profiler Sample will record the execution time for you and it will be displayed in the Profiler window without the need to use the Deep Profiling.
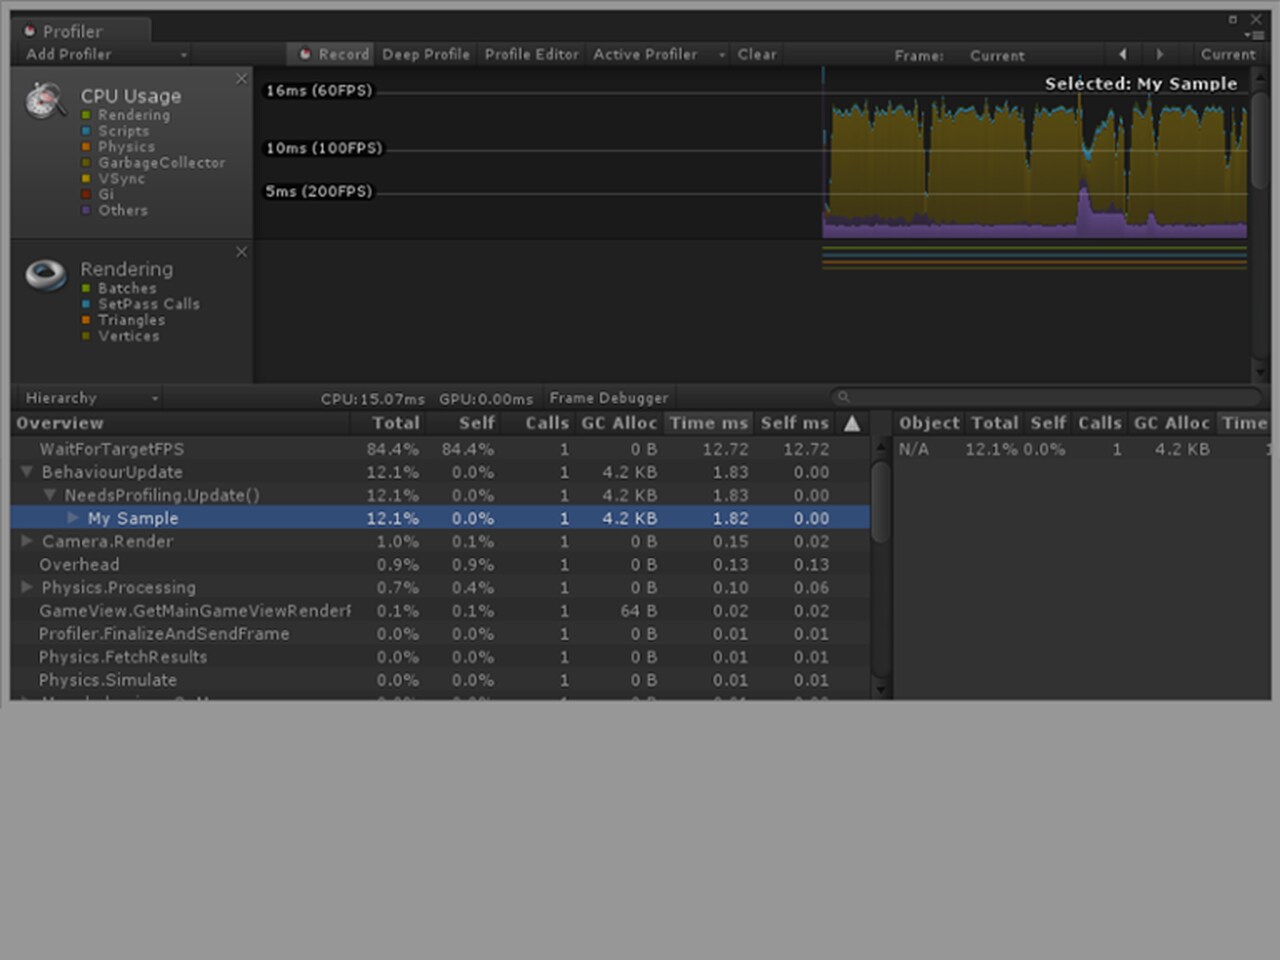
As you can see, there’s a new entry in the Profiler Hierarchy!
Of course you can add as many Profiler Samples as you want. It’s completely up to you! Don’t worry about adding too many samples. These calls have zero overhead when they are deployed in non-development build.
