In order to empower your Unity game with useful features like user accounts, leaderboards, achievements, and cloud saves, you are going to need a web service. Of course, you wouldn’t write one on your own, so most probably you’re thinking of using services like GameSparks or App42. If so, you should learn how to debug it.
Having a REST
If you’re not familiar with what REST is, then it’s the best time to acquire new knowledge. It’s not difficult and no, it’s not another language. It’s just an architecture, a set of rules to follow to make a good API. Thanks to REST all API services look very familiar and are easy to learn. Here’s a good place to start.
Now, when you know that REST calls are nothing else but regular HTTP requests, you may find monitoring all the http traffic between your game and web service as very useful. You may want to do this because:
- This may be the only way to see the client-server communication
- Client request may not be what you’ve expected it to be
- Server response may tell you about other things than client library errors
- Client library may have bugs that can be revealed in this way
Let’s be honest, you will encounter issues. How fast you will deal with them depends on your debugging skills. If there’s a possibility to peek into client-server communication, why you not just do it?
Wireshark?
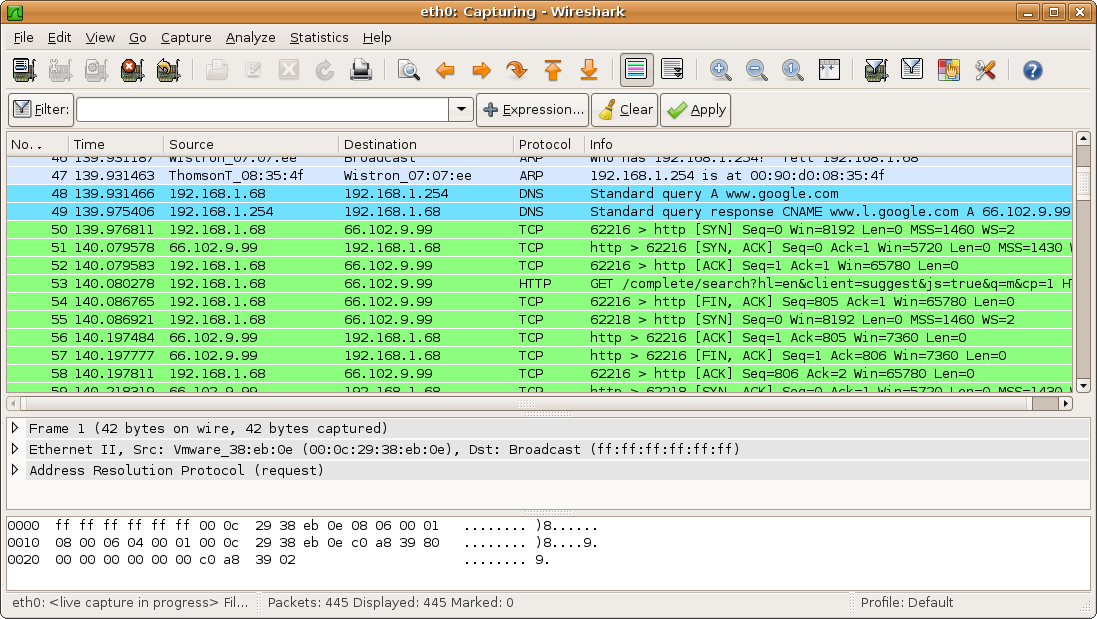
Most people when asked about looking into client-server communication think about Wireshark. It’s the easiest way to get hands on the full communication and while Wireshark does his job very well, I’d like to recommend something else for debugging.
Fiddler!
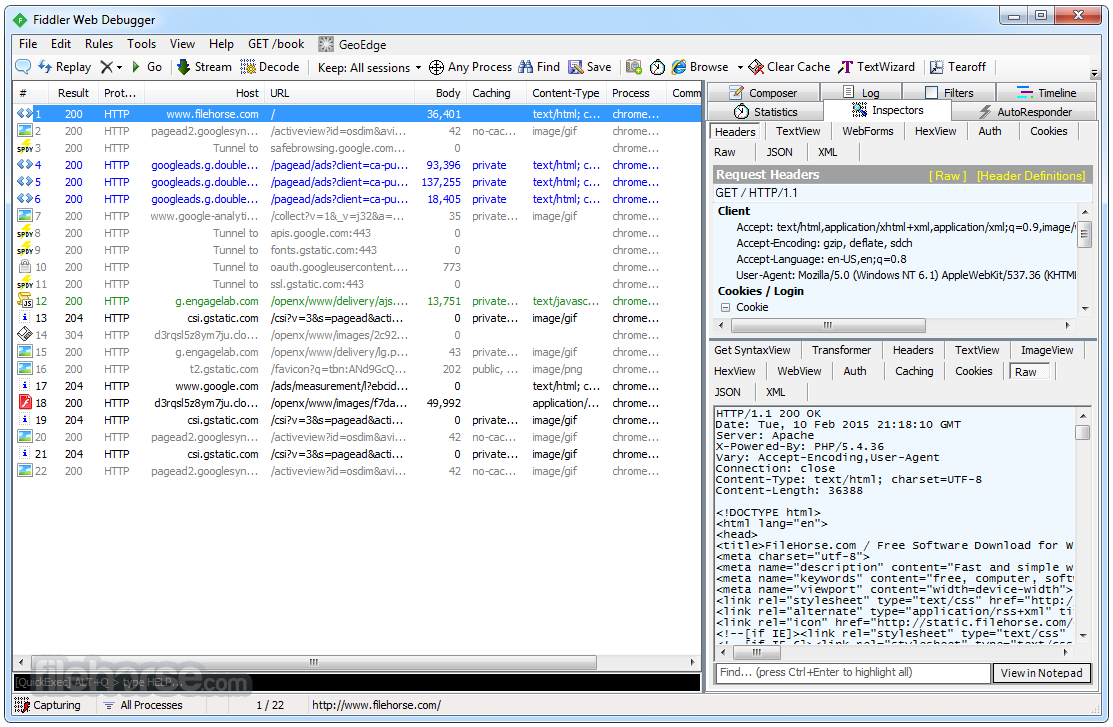
Telerik Fiddler is available for free for Windows and at the time of writing of this article there’s also OS X beta version available.
What makes Fiddler so special? Especially the fact that it debugs your http traffic using build-in tools so easily. It also has a very simple user interface that is easy to understand and use. Requests and responses can be displayed as a raw text or formatted one as JSON or XML if you expect this kind of data to be in there. On top of that you can customize the requests/responses view to see the data that you’re concerned of and you do this without any trouble.
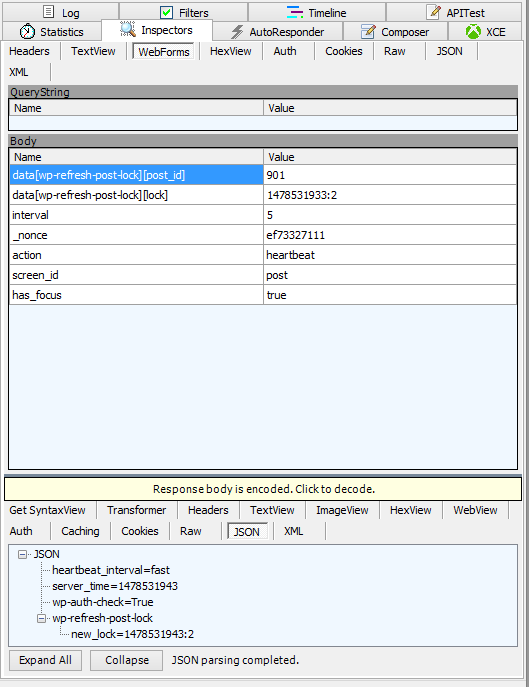
Do not confuse Fiddler with the packet sniffer. It does not listen to your web interface, instead it installs itself as a default system proxy. It has its pros and cons. By doing that, it can easily decrypt HTTPS communication (yeah!), but on the other side not all applications accept the default system http proxy settings. One of these applications is…
Unity
Of course by “Unity” I also mean all apps running on Unity engine. I cannot tell for sure why Unity does not work well with Fiddler, but I know how to make it work with it. There’s a great blog post about it written by Bret Bentzinger. The steps go as follows:
Windows
- Make sure Unity is not running
- Navigate to UNITY_INSTALL_DIR\Editor\Data\Mono\etc\mono\2.0
- Edit machine.config file and inside <system.net> add the following:
<defaultProxy>
  <proxy proxyaddress="http://localhost:8888"/>
</defaultProxy>
OS X
- Make sure Unity is not running
- Locate the Unity application icon
- Right-click on it and choose “Show package contents”
- Navigate to Contents/Frameworks/mono/etc/mono/2.0
- Do step 3 from the Windows instructions
Important: Make sure to undo these changes after you’re done with debugging!
More about Fiddler
Did I help you make your mind? If yes, you might want to see some more learning resources about Fiddler.
Happy debugging!

