Have you ever stared at Unity Profiler trying to figure out what is really a bottom cause for performance hiccups of what you should put your efforts into in terms of optimizing your game? Or maybe you always wanted to compare two Profiler data? Profile Analyzer tool is the answer to this.
The Profile Analyzer aggregates and visualizes data from Unity’s built-in Profiler, offering insights into CPU usage, rendering times, and other performance metrics. By analyzing this data, you can pinpoint areas where the game may be underperforming and prioritize optimizations accordingly.
Let’s dive into the details!
How to get started
You can install Profile Analyzer via Window > Package Manager.
After opening the Profile Analyzer window you can see a couple of buttons. You can switch between Single and Compare mode, Export profiler data as CSV files, Pull Data from Profiler, Load or Save .pdata file (this is the data representing Profile Analyzer session).
In order to get started, first you have to capture some data with the Profiler. Once it is done, the Pull Data button in the Profile Analyzer will enable. Click it to pull the captured data from Profiler. You can also load previously saved Profiler data into the Profiler and then pull this data to the Profile Analyzer.
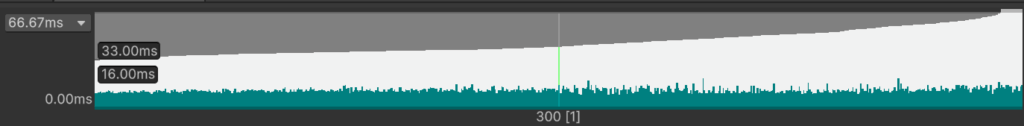
Once you’ve loaded your data, you’ll see it in the frame time graph. This is an interactive region – you can select a range of frames you want to analyze further.
The analysis starts immediately, and the data populates the frame time graph. On the top you can see white and cyan bars. The white bars represent the frame durations, the cyan bars however represent the currently selected marker. This allows you to compare the selected marker’s contribution to total frame time.
Filters
You can search for markers using Filters. The Marker Details automatically update to reflect the subset that you’ve selected, and in the Count column you’ll see how many occurrences it has. The frame time graph highlights the marker. When you select a marker, the Marker Summary details panel also updates to show analysis statistics for that particular marker.

There are following Filter available:
1) By name
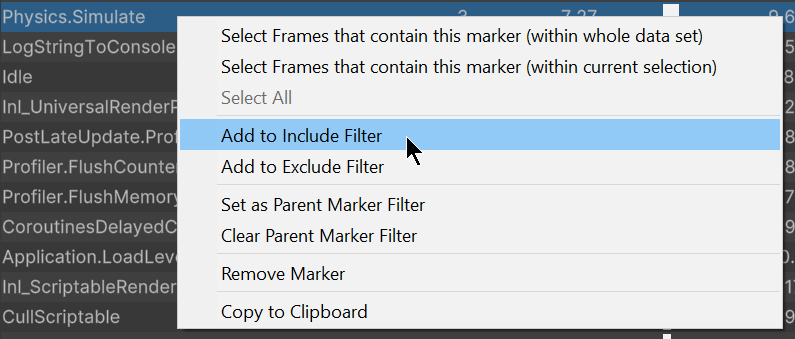
You can search markers by substring ot a collection of substrings. If the name contains spaces, make sure to put quotes around the substring. The same goes for Exclude Names Filter. You can also populate marker filters by right-clicking on a marker of interest in the table and adding it to the filter selection.
2) Remove Filter
You can also choose to hide one marker and all child samples under these markers from the data, both in the tables and the graph. You can remove markers by selecting and choosing the Remove Marker option from the right click context menu.
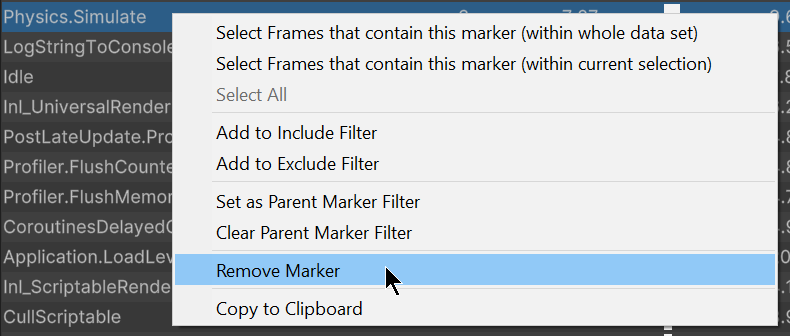
You can only remove one marker at a time; you can add a marker back by choosing None in the dropdown.
3) Threads
You can choose to see data for specific worker threads. To see all of them aggregated, check “All” at the top of the thread Select pop-up window.
4) Depth Slice
You can select marker callback depth to analyze.
5) Parent
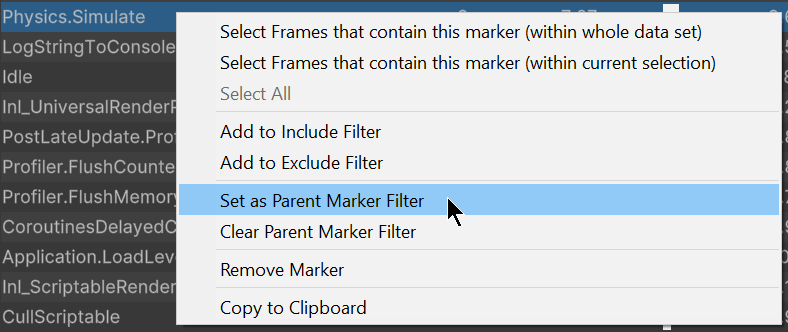
To filter by parent, right-click on the marker in the marker table and select Set as Parent Marker Filter.
6) Analysis Type
By default, the Profile Analyzer shows you Total time for the markers, but you can change to Self time. Self time is useful if you want to drill down to details to see where your time is really spent.
7) Units
The default units are milliseconds, but for smaller timings, you can switch to microseconds.
8) Marker Columns
This filter enables you to customize columns of the Marker Details section for your current needs.
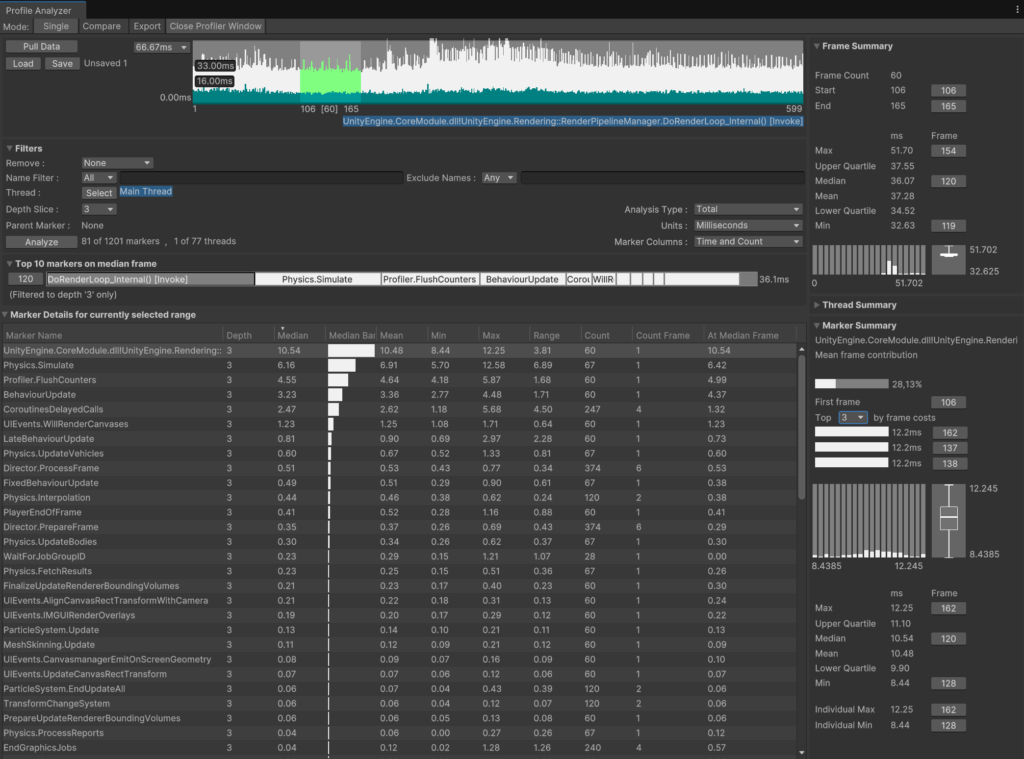
Top 10 markers on median frame
This section shows the top 10 markers for the filters that you’ve selected. It is a very powerful tool if used properly.
For example, most Unity’s subsystems have high-level markers at depth 3. Knowing that you can set Filters to:
- Thread: Main Thread
- Analysis Type: Total
- Depth Slice: 3
This will show you the most consuming markers of Unity’s subsystems. This is a good way of making the very first diagnoze of your game’s performance.
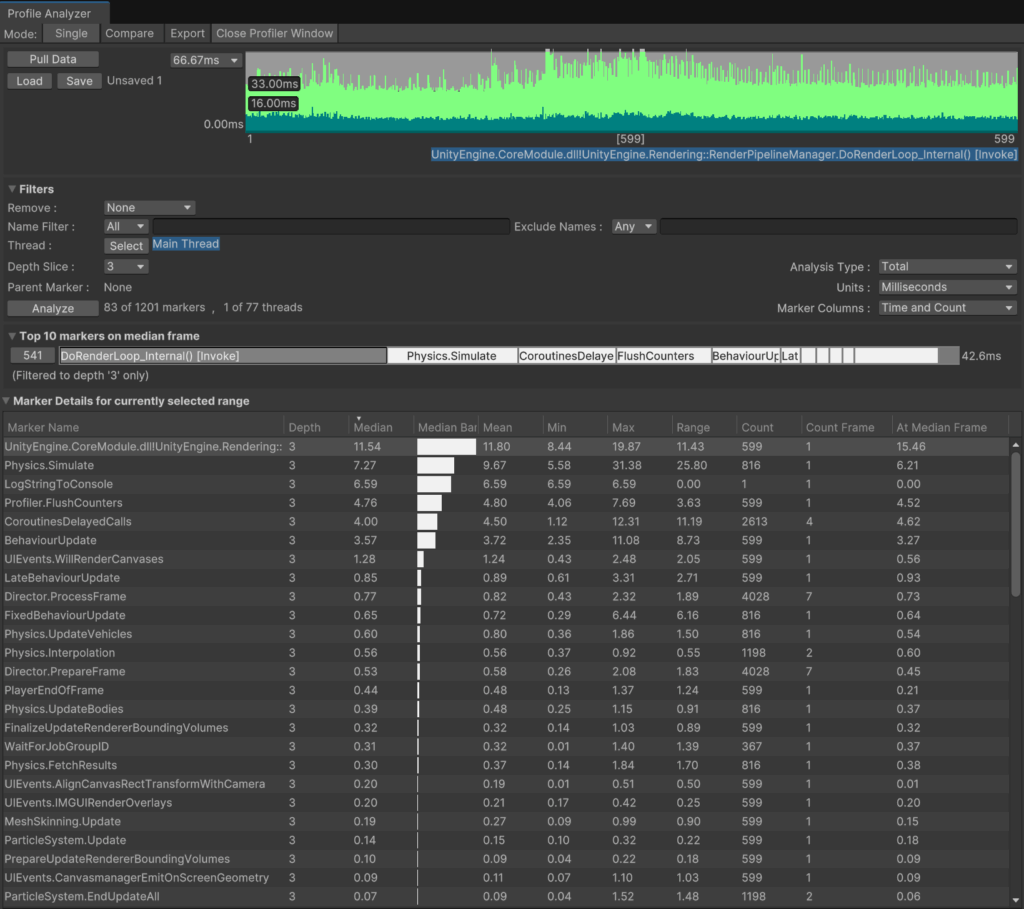
Marker Details
At the bottom of the Profile Analyzer window you will find a table of the marker data from the Profiler, based on the filters you applied. The Unity Profiler data for all the markers are aggregated to provide median and other frame times, which are also displayed in this table. You can sort this data freely by any column.
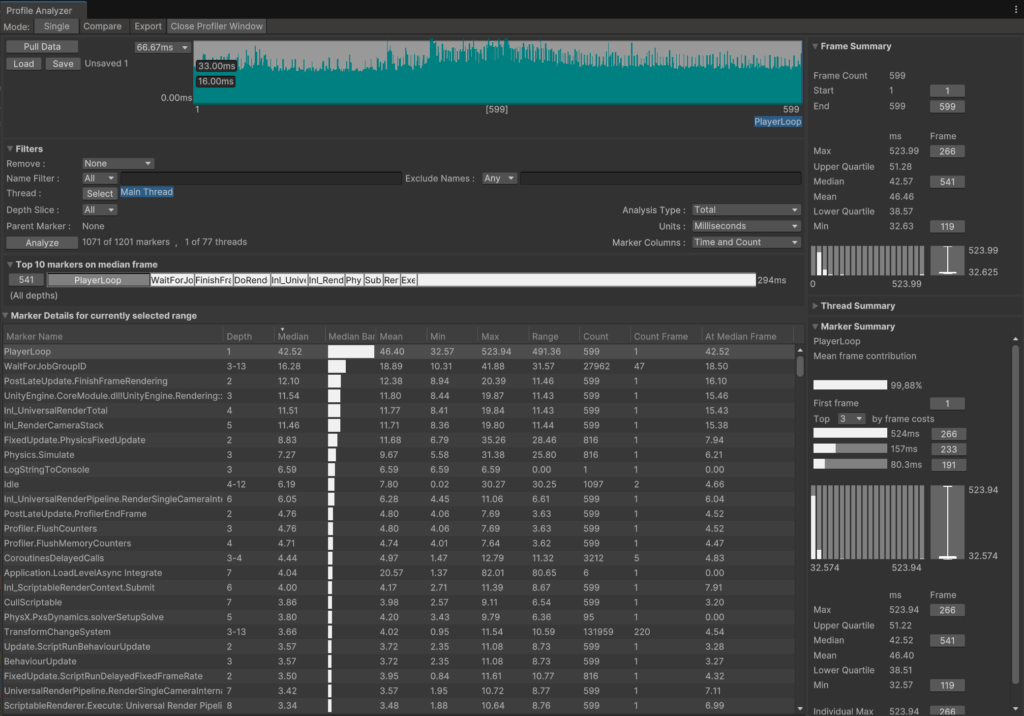
Frame Summary and Marker Summary
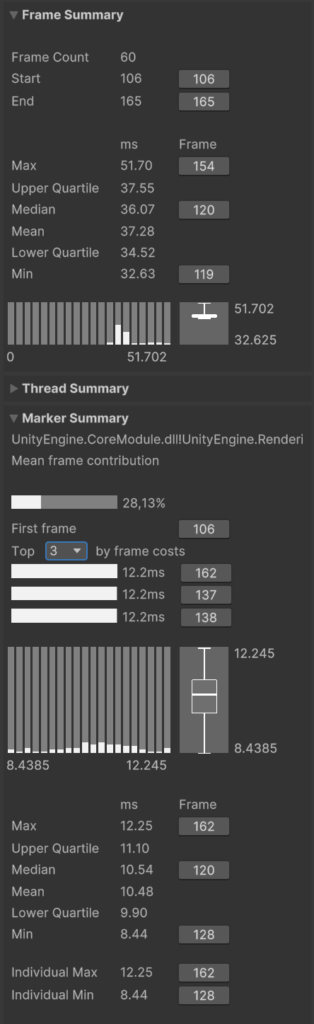
The right side of the Profile Analyzer window starts with Frame Summary which displays highlights on the frame time, including the minimum, maximum, and median, with buttons that let you jump to specific frames in the Profiler. This area also shows you the frame time distribution histogram and a box and whisker plot.
Below that there is the Marker Summary which shows the current selected markers contribution to the frame time. You can see up to 10 most costly frames of that marker and preview nice graph representing times on selected frames. At the bottom, there is information about the minimum and maximum times for individual marker instances within the aggregated data set.
Make it work
It is important to remember that the Profile Analyzer should be used alongside Unity’s Profiler. In other words, Profile Analyzer can help you filter through the most important markers and find frames that are the most important which you can then keep analyzing in the Profiler.
It is important to make sure that the data you’re looking at is representative. You can easily find the representative frame using Profile Analyzer Frame Summary. Just click on the Median frame from the selection of frames range – it will select this frame in the Profiler. You can also right-click on the frame time graph and select Select Median Frame.
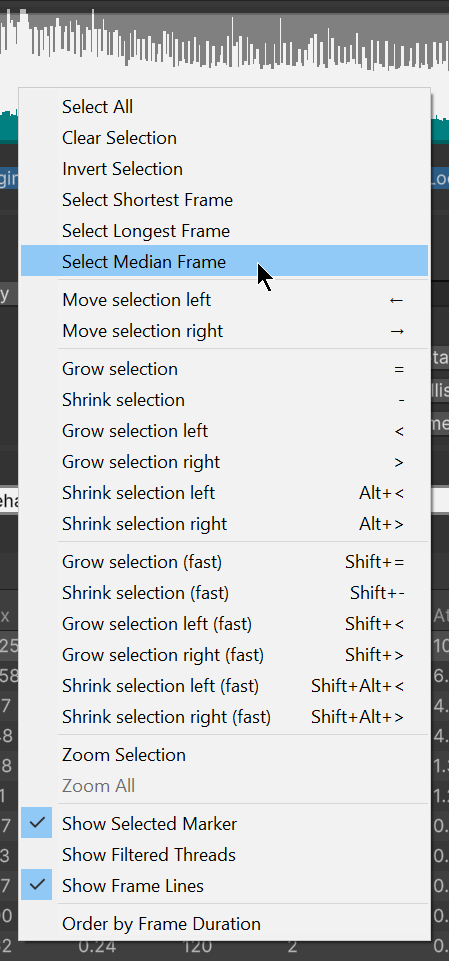
But let’s not limit ourselves to single point entry. Right-click on the frame time graph and select Order By Frame Duration. Now you can select a set of frames around the median frame for a representative sample that smooths out some of the noise in your data.
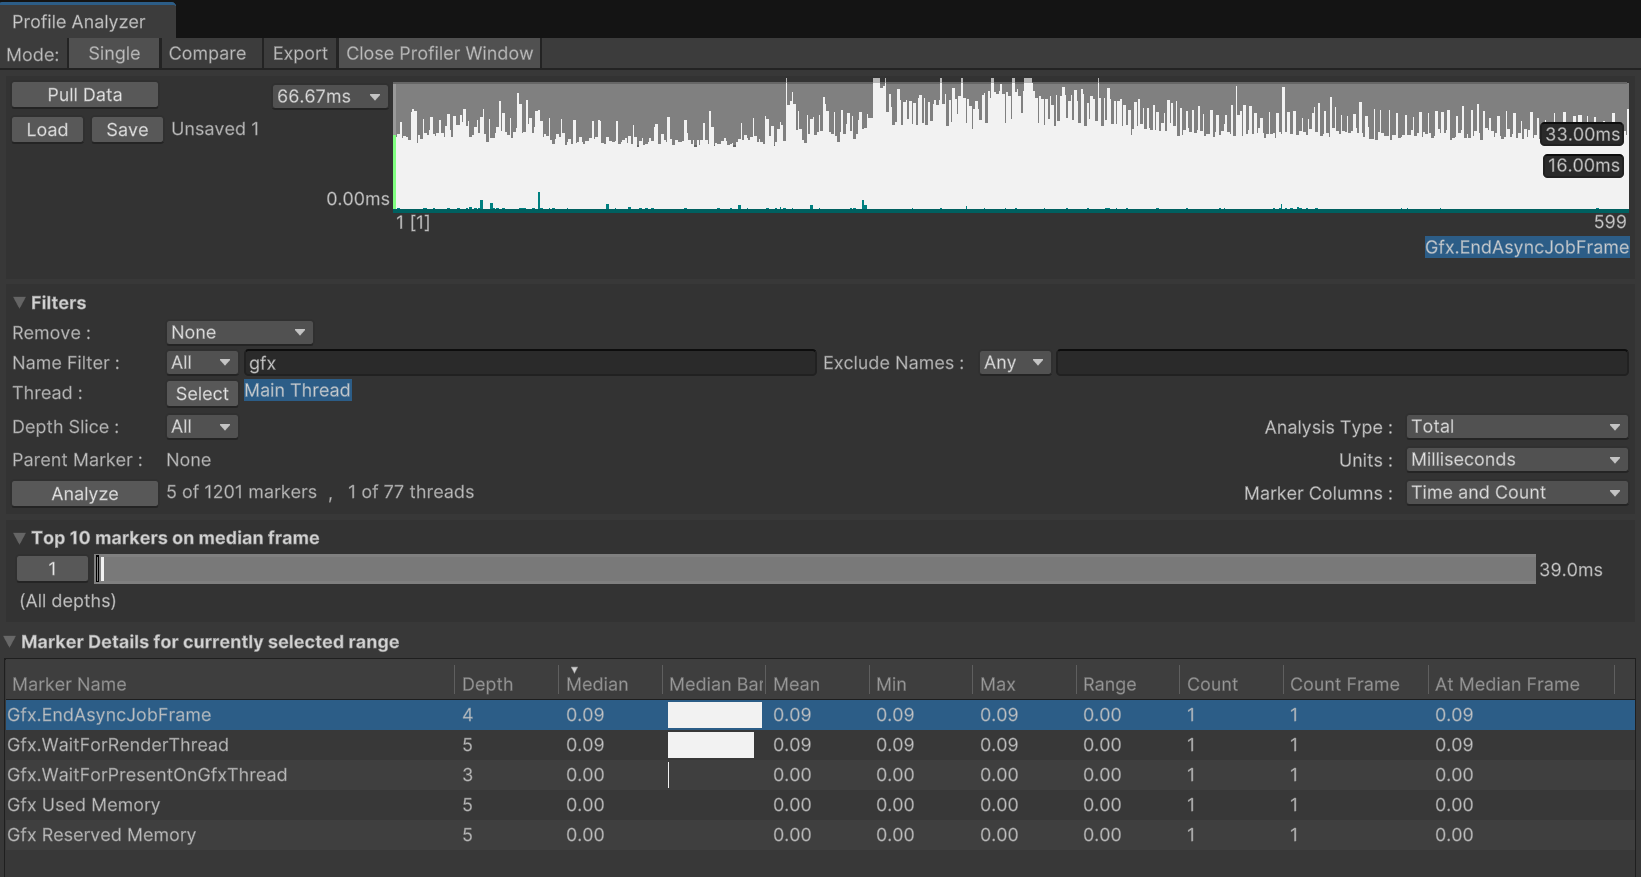
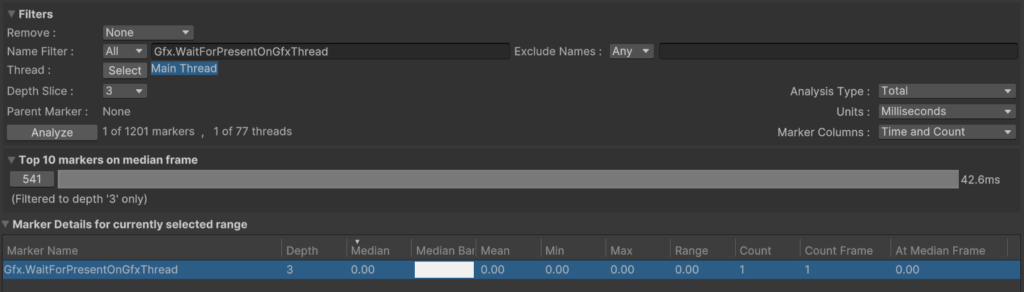
How to check if you are GPU-bound?
You can do it pretty easily with the Profile Analyzer. First, find the Gfx.WaitForPresentOnGfxThread marker by typing its name to Name Filter. Analyze its data – if the median value of that marker is non-zero, then the CPU is waiting on the GPU to finish its activity before it can continue, aka – you are most likely GPU bound.
Comparing data sets
Lastly, you can compare two sets of Profiler data. To do it select Compare mode at the top of the Profile Analyzer window. Then pull data from two different Profiler data sets. You can also pull data from one Profiler data set to compare for example two different frame ranges.
One data set is displayed in blue, and the other in orange. Additionally, every section of the Profile Analyzer window now visualizes loaded data sets, so you can quickly compare them.
You can use this mode to e.g. check the effect of the global project setting change such as Graphics Jobs or Physics Solver Type. To do that, first make a baseline Profiler capture then, run the game the second time after applying the changes and make another capture. Pull both captures to the Profile Analyzer and compare results in the Frame Summary section.
Exporting data
It is good to remember that you can export the Profile Analyzer data to CSV format for further analysis. It is recommended to store that data alongside the Profiler capture data which it was generated based on.
Time to analyze!
Profile Analyzer brings new quality to the process of analyzing Profilers data. Finding bottlenecks and key performance indicators is now much easier than ever. Do not hesitate, check it yourself!